Observing Applications
Application Logs
Spin handles application logs by default, storing output and error messages from file system-run applications in the .spin/logs directory alongside the manifest file’s location. Users have the option to direct logs to a specific folder using the --log-dir flag of the spin up command. Additionally, if users wish to prevent stdout and stderr from being written to disk, they can specify an empty string for the --log-dir flag, i.e. spin up --log-dir "" - effectively disabling log storage. See the persistent logs section for more details.
OpenTelemetry (OTel)
Spin now has support for the OpenTelemetry (OTel) observability standard. You can learn more about observability here. When configured, Spin will emit telemetry about your Spin App in the form of OTel signals: traces, metrics, and logs.
Using the OTel Plugin
We have a plugin that makes it easy to use OpenTelemetry with Spin. If you would like to examine the source code, you can visit the GitHub repository. Otherwise, follow these instructions:
-
To install the plugin, run the commands below:
spin plugins update spin plugins install otel -
To see the available commands, you can run
spin otel --help
Configuring your own observability stack
Follow this portion of the guide if you want to use Spin and OTel, but want to have more control than what the OTel plugin offers.
Configure the Docker compose stack
In order to view the telemetry data you need to run an OTel compliant collector and the proper backends for each signal type. If you have Docker on your system you can easily start all the observability tools you need with the following commands:
cd  ~
git clone git@github.com:fermyon/spin.git
cd spin/hack/o11y-stack
docker compose up -d
This will start the following services:
- OTel Collector: Collector to receive OTel signals from Spin and forward to the appropriate backends.
- Jaeger: Backend for traces.
- Tempo: Alternative backend for traces.
- Loki: Backend for logs.
- Prometheus: Backend for metrics.
- Grafana: Dashboard for viewing data stored in Tempo, Loki, and Prometheus.
Configuring Spin
To have Spin export OTel telemetry to the collector you need to set the following environment variable:
OTEL_EXPORTER_OTLP_ENDPOINT=http://localhost:4318 spin up
This will enable all OTel signals. If you only want to enable specific signals you can set the following environment variables individually:
- Traces:
OTEL_EXPORTER_OTLP_TRACES_ENDPOINT - Metrics:
OTEL_EXPORTER_OTLP_METRICS_ENDPOINT - Logs:
OTEL_EXPORTER_OTLP_LOGS_ENDPOINT
For example this would enable exporting of traces and metrics:
OTEL_EXPORTER_OTLP_TRACES_ENDPOINT=http://localhost:4318/v1/traces OTEL_EXPORTER_OTLP_METRICS_ENDPOINT=http://localhost:4318/v1/metrics spin up
Storing lots of trace data can get expensive. You may want to sample traces to reduce the amount of data stored. You can set the following environment variable to control the sampling rate:
OTEL_TRACES_SAMPLER=traceidratio OTEL_TRACES_SAMPLER_ARG={desired_ratio} OTEL_EXPORTER_OTLP_ENDPOINT=http://localhost:4318 spin up
Under high request loads Spin will start dropping OTel data. If keeping all of this data is important to you there are environment variables you can set:
OTEL_BSP_MAX_CONCURRENT_EXPORTS=4 OTEL_BSP_MAX_QUEUE_SIZE=4096 OTEL_BSP_SCHEDULE_DELAY=1000 OTEL_EXPORTER_OTLP_ENDPOINT=http://localhost:4318 spin up
Spin supports a wide array of OTel configuration options beyond what we’ve covered here. You can read more about them here and here.
Traces
After sending some requests to your Spin app, navigate to Jaeger http://localhost:16686 to view the traces.
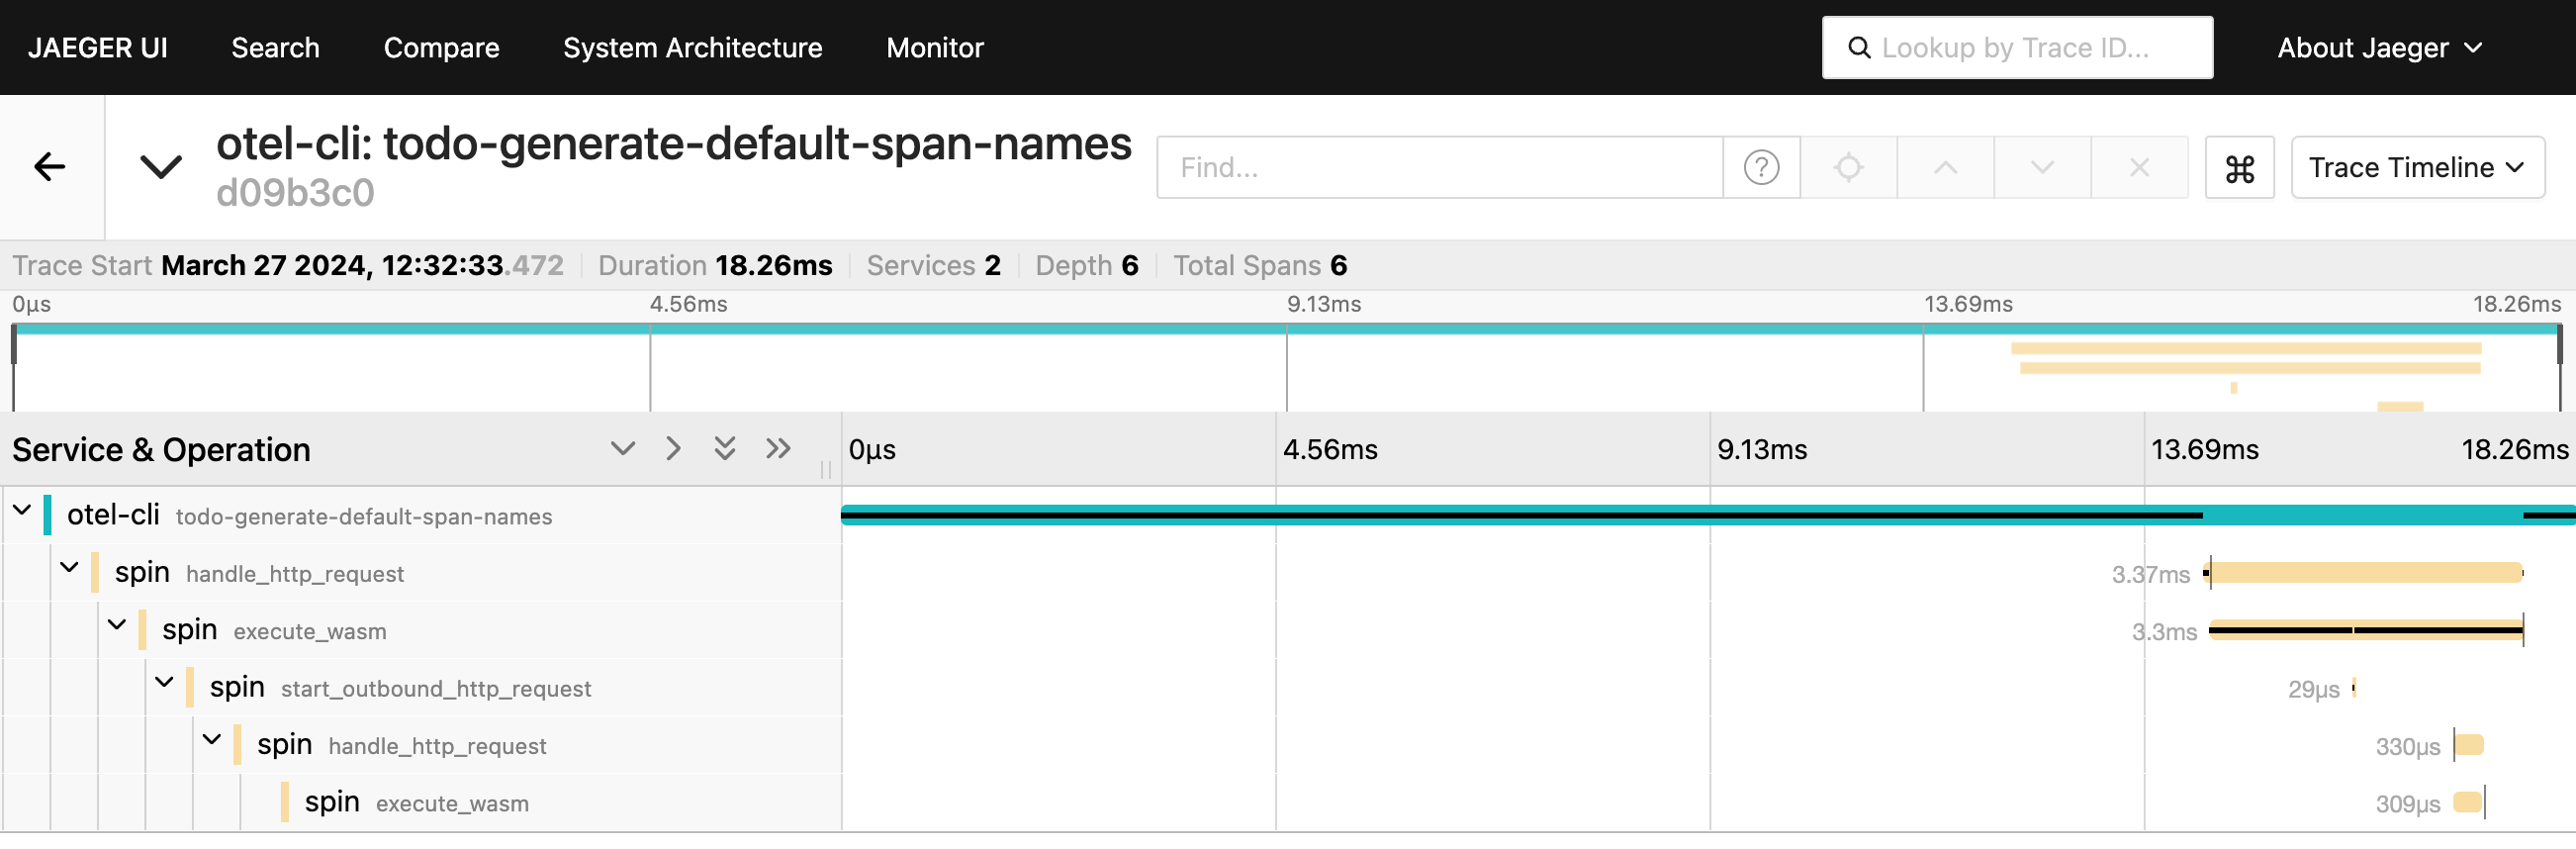
Spin supports both inbound and outbound trace context propagation. This allows you to include Spin in your distributed traces that span all your services.
Metrics
Navigate to http://localhost:5050/explore to view the metrics in Grafana. Make sure to choose the Prometheus data source from the top left dropdown menu.
Logs
Navigate to http://localhost:5050/explore to view the logs in Grafana. Make sure to choose the Loki data source from the top left dropdown menu.
Spin will still emit application logs as described in the Application Logs section. However, it will also send the logs to the OTel collector.